Psychological researchers try to understand how the mind works. That is, they describe observable phenomena, try to induce explanatory theories, and use those theories to deduce predictions. The explanatory value of a theory is then assessed by comparing theoretical predictions to new observations.

A good theory ideally makes precise predictions about new observations (Roberts & Pashler, 2000). While this sounds trivial, it is important to consider what it means to make precise predictions. A theory that can, in principle, predict any outcome is precise in the sense that it offers an explanation for every observation. At the same time the theory is imprecise because it is unspecific: It cannot inform our expectations about future events because it makes no prediction about what will not happen. In this sense, the theory is useless. Nobody would hire a financial adviser that can always explain why their client’s past investments failed but can never tell them where to invest next. Thus, an ideal theory predicts only what we observe and declares every other possible outcome impossible.
The law of parsimony—Occam’s razor—famously demands that we should prefer the simplest complete explanation of a phenomenon. One rationale is that simpler explanations are easier to understand, test, and falsify. Moreover, unnecessarily complex explanations yield inaccurate predictions about future events because they tend to assume causal reasons for random events that are unlikely to repeat in the future—a concept that in statistics is referred to as overfitting.
One way to conceptualize the simplicity (or complexity) of a theory is to examine the range of observations it can, in principle, explain. Following this reasoning, theories that can explain many different observations are complex; theories that can explain only very few observations are simple. Psychological theories are often verbal descriptions of assumed social or mental processes. As I will illustrate, at this level of specificity, it is often difficult to assess what exactly a theory predicts and how simple the explanation is. Mathematical models can be used to address this problem.
The number of mathematical models of cognitive processes is growing exponentially (Palminteri, Wyart, & Koechlin, 2017). However, many students of psychology and a fair number of researchers have limited knowledge about this approach to understanding the mind. In this blog post I will try to illustrate how theoretical positions can be expressed in mathematical terms as measurement models1. I will argue that formalizing a theory mathematically helps to understand it and to derive testable predictions. Finally, I will then show conceptually how the derived predictions can be tested. But first, I will try to explain some of the basic vocabulary of mathematical modeling by analogy of familiar statistical models.
What is a mathematical model?
To some the terms “mathematical model” or “formal model” may be daunting. Quite simply, a mathematical model is an expression of assumptions about how the observed data came about (i.e., about a data generating process). For example, a simple bivariate linear regression model is a mathematical model that, among other things, assumes that the relationship between two variables follows a straight line with an intercept \(a\) and a slope \(b\),
\[
\hat y_i = a + b \times x_i,
\]
for every observation \(i\)2. The intercept \(a\) and the slope \(b\) are the parameters of the model that quantify components of the data generating process.
To find the combination of parameter values that best describe a dataset the model is fit to those data. For some models, such as this linear regression model, formulas are available to calculate the most likely parameters. When this is not the case, the parameter values have to be cleverly guessed by an optimization algorithm that minimizes the discrepancy between model predictions \(\hat y_i\) and the observed data \(y_i\) (e.g., quantified by the root-mean-square error, \(\mathrm{RMSE} = \sqrt{\frac{1}{n}\sum^{n}_{i = 1}{(\hat y_i – y_i)^2}}\). The guessed parameter values can be used to visualize the model’s best description of the data. A visual comparison between observed data and the model description may reveal gross deviations and helps to understand what aspects of the data can be explained by the model and what aspects cannot.
To illustrate the process of fitting a linear regression model to data consider the following example inspired by Kortt & Leigh (2010)—the data used here are simulated. The authors asked “Does Size Matter?”, that is, are (logarithmized) hourly wages related linearly to body height? The relationship is visualized in the top left panel of Figure 1.
When fitting a model to data the optimization algorithm starts with an arbitrary set of parameter values, which are then adjusted step-by-step until they converge on the best description of the data. This process is illustrated by the convergence of the grey line towards the blue line. The stepwise reduction of the discrepancy between model predictions and the observed data that guides the optimization algorithm is visualized in the top right panel and the corresponding parameter values in the bottom panels of Figure 1. The final model describes the linear relationship between hourly wages and body height quite well.
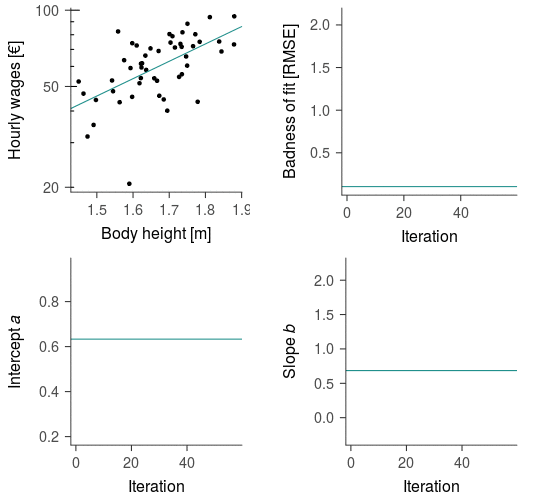
Figure 1: Iterative estimation of linear regression model parameters predicting a person’s (logarithmized) hourly wages from their body height. The linear function is iteratively adjusted to the data by repeatedly trying parameter values that minimize the discrepancy between model predictions and the observed data. The blue lines indicate the optimal values derived from the analytical solution. The data used here are simulated.
Just like linear regression models, the parameters of many cognitive models can be estimated by fitting these models to data. What makes cognitive models interesting is that their parameters quantify assumed unobservable (latent) cognitive processes. That is, the parameter values usually have psychologically meaningful interpretations. I will provide some examples after some further discussion of the advantages of expressing psychological theories in mathematical terms.
What are mathematical models of cognition good for?
Expressing a theory about cognitive processes mathematically has at least three advantages. First, translating a verbal theory into a set of formulas requires specification and explicates underlying assumptions. Second, mathematical models yield specific predictions that can inform experimental tests of theories and can be used to assess a model’s complexity. Third, if we accept the assumptions of a given model, we can use the model to decompose participant responses to focus on the psychological processes of interest.
In their introductory book on computational modeling, Lewandowsky & Farrell (2011) illustrate the benefit of explicating assumptions mathematically. They attempt to translate a component process of Baddeley’s theory of working memory (Baddeley, 1986), namely the phonological loop, into a mathematical model. In the process they track the decisions about technicalities that are necessary for the implementation of the models’ mechanisms, such as the decay function or the decay rate. Lewandowsky & Farrell (2011) illustrate that there are at least 144 mathematical models of the phonological loop and conclude that a “verbal theory of working memory actually constitutes an entire family of possible models.” (p. 39, Lewandowsky & Farrell, 2011) This example clearly shows that verbal descriptions of theories are ambiguous.
The uncertainties about the specifics of a model that result in 144 candidate implementations of the theory entail uncertainty about the model’s predictions. A fully specified model allows the researcher to derive specific predictions for an experimental setup before she collects the data. These specific predictions are an important benefit to mathematical modeling.
Exploration of specific model predictions can inform the design of experiments to pit competing cognitive models against one another. Cognitive models can best be compared in conditions for which the models make diverging prediction. When such diverging prediction have been identified the researcher can explore the models’ parameter settings that yield the largest disagreement between the models. Based on this exploration the researcher can design an experiment that constitutes a maximally informative comparison between the models. This approach can even be implemented in a continuous manner while the data are being collected (Cavagnaro, Myung, Pitt, & Kujala, 2009; Myung & Pitt, 2009; Myung, Cavagnaro, & Pitt, 2013). Here on every trial the stimulus for which the models make the most diverging predictions (the response to which will be most informative) is presented. Conversely, the researcher may learn that the models make very similar predictions for the planned experiment. In this case the study would not provide a strong test between the models, is unlikely to be informative, and should be revised.
Exploration of model predictions, moreover, reveals a models’ complexity—the range of observations a model can explain. As discussed above, researchers should prefer simple explanations and thus model complexity should be penalized when researchers compare model predictions. This is difficult when a theory is expressed in words. For mathematical models, a variety of approaches to penalize model complexity in a principled manner are available (Myung & Pitt, 1997; Myung, Navarro, & Pitt, 2006; Pitt, Myung, & Zhang, 2002). Such statistical model comparisons instantiate comparisons of competing psychological theories.
Exploration of model predictions can also build an intuition as to how a model works and what “makes it tick”. That is, what are the crucial assumptions that allows the model to describe a specific pattern of results or that are responsible for empirically unsupported predictions. Such detailed understanding of the model mechanics facilitates model revision and theory development.
Finally, by fitting a cognitive model to data researchers can decompose the observed responses into the assumed cognitive processes. If the model assumptions are sensible, the parameter estimates constitute a more direct measures of the cognitive process of interest than the observed variable. In this sense, the model acts as a measurement model separating processes that researchers may be interested in from nuisance processes—measurement noise. This point will become clear when I introduce the example application in the next section.
How are predictions derived?
To illustrate some of the benefits of mathematically modeling cognitive processes I draw on an example from research in episodic long-term recognition memory. Here researchers try to understand how we judge whether we have seen something before, that is whether we perceive something to be ‘old’. A fundamental issue in the theoretical debate concerns the nature of the information that we base such judgments on3.
Latent-strength theories of recognition memory postulate that retrieval from memory yields a mnemonic signal of varying strength (e.g., Eich, 1982; Hintzman, 1984; Kahana & Sekuler, 2002; Murdock, 1993; Nosofsky & Palmeri, 2014; Shiffrin & Steyvers, 1997). This unobservable signal is assumed to be what we experience as familiarity. Things that elicit a strong signal feel familiar; things that feel familiar are likely judged to be old. It is assumed that the memory system always produces a signal of continuously varying strength. Conversely, our judgments should always be informed by a memory signal; hence, there is no such thing as random guessing.
Discrete-state theories posit that memories are either retrieved or they are not—there are no intermediate states or nuanced mnemonic strength signals that factor into the decision process (e.g., Blackwell, 1963; Bröder & Schütz, 2009; Luce, 1963). If a memory is not retrieved it is assumed that we guess randomly.
It is not obvious from these verbal descriptions how to pit these theories against one another. Fortunately, both theoretical positions have been implemented in a variety of mathematical models. For this example I will consider two variants of the well-known signal detection theory (Macmillan & Creelman, 2005; Swets, Tanner, & Birdsall, 1961) to stand in for the latent-strength perspective and the high-threshold model (Blackwell, 1963) will represent the discrete-state perspective. I will introduce the latter model first.
The high-threshold model

Figure 2: Schematic depiction of the latent states in recognition memory decisions as assumed by the high-threshold model.
The high-threshold model (HTM; Figure 2; Blackwell, 1963) assumes that when participants judge whether they have seen something before they attempt to retrieve a memory of that thing. If the thing has indeed been previously encountered, the retrieval of the corresponding memory succeeds with some probability \(p\). The model does not specify how this retrieval process proceeds. When no memory is retrieved the participant is in a state of ignorance—no information is available that could sway the judgment one way or the other. Hence, the only way to make a judgment is to resort to guess ‘old’ with probability \(b\) or guess ‘new’ with probability \(1 – b\). In case where participants are asked about something they have not encountered before the probability to retrieve the corresponding memory is assumed to be \(p = 0\)—participants always guess. Because memory retrieval and guessing are assumed to be independent processes the rate of old responses can be calculated as dependent probabilities,
\[
\begin{align}
\text{Hits} & = & p(\text{‘Old’}|\text{Old}) & = p + (1-p) \times b \\
\text{False alarms} & = & p(\text{‘Old’}|\text{New}) & = b.
\end{align}
\]
If we are willing to accept the assumptions of HTM as reasonably accurate description of the cognitive processes involved in old-new recognition we can use this model to isolate memory performance from guessing. As both memory retrieval and guessing factor into the correct recognition of previously encountered things, the rate of ‘old’ responses—also known as hit rate—is a crude measure of memory performance. Observed changes in hit rates can result from changes in memory performance or changes in guessing behavior. However, by rearranging the above formula we can subtract out the ‘old’ responses that are due to guessing. This gives us an estimate of the probability of successful memory retrieval \(\hat p\)—a more direct measure of memory performance,
\[
\hat p = \frac{\text{Hits} – \text{False alarms}}{1 – \text{False alarms}}.
\]
In this sense, HTM can be interpreted as a measurement model, a theory of origin and effects of measurement error in old-new recognition. There are more assumptions models that attempt to specify how the retrieval of memories proceeds and why it may fail. As such models specify larger portions of the involved cognitive processes they are also referred to as process models. I will not cover process models in this blog post.
Signal detection theory

Figure 3: Schematic depiction of the latent mnemonic strength distributions for old and new probes in recognition memory judgments as assumed by equal- and unequal-variance signal detection theory.
The assumptions of signal detection theory (SDT; Figure 3; Swets et al., 1961) are slightly more involved. It is assumed that every memory probe elicits a mnemonic strength signal. Things that have previously been encountered elicit stronger signals than things that are new. If the mnemonic signal strength surpasses a response threshold \(c\) the participant endorses the probe as ‘old’. This threshold is an index of response bias and indicates how easily a person is convinced that they have encountered something before. However, the strength of the mnemonic signal for old and new memory probes is not fixed, it is assumed to be normally distributed. As a consequence, some new memory probes elicit a stronger signal than old probes. Assuming variability in the mnemonic signal is not only plausible but also necessary. If the model assumed fixed signal strengths for either old or new probes it would predict that either all or none of the respective probes would be judged as old, depending on the location of the response threshold. It follows from these assumptions that the rate of old responses can be calculated as the area under the curve of the respective normal distributions above the threshold \(c\),
\[
\begin{align}
\text{Hits} & = & p(\text{‘Old’}|\text{Old}) & = \Phi(\frac{\mu_{Old} – c}{\sigma_{Old}}), \\
\text{False alarms} & = & p(\text{‘Old’}|\text{New}) & = \Phi(\frac{\mu_{New} – c}{\sigma_{New}}),
\end{align}
\] where \(\Phi\) is the cumulative distribution function of the normal distribution. \(\mu_{Old}\) and \(\mu_{New}\) are the mean mnemonic strengths for old and new probes, \(\sigma_{Old}\) and \(\sigma_{New}\) are the standard deviations of the strength distributions.
In classic equal-variance signal detection theory (EVSDT) the dispersion of the distributions \(\sigma_{Old}\) and \(\sigma_{New}\) are assumed to be equal. Unequal-variance signal detection theory (UVSDT) is more complex in that it is assumed that \(\sigma_{Old}\) can be greater than \(\sigma_{New}\).
The distance between the two distributions \(d_a\), that is, the average difference in mnemonic strength between old and new memory probes, is an index of discriminability or sensitivity and, thus, of memory performance,
\[
d_a = \frac{\mu_{Old} – \mu_{New}}{\sqrt{0.5(\sigma_{Old}^2 + \sigma_{New}^2})}.
\]
In EVSDT, sensitivity is typically denoted as \(d’\). Without loss of generality it is assumed that \(\sigma_{Old}^2 = \sigma_{New}^2 = 1\). This is an arbitrary choice and could, in principle, be fixed to other values without changing the model.
Again, if we are willing to accept the assumptions of SDT as reasonably accurate description of the cognitive processes involved in old-new recognition, we can use this model to isolate memory performance from response bias. In case of EVSDT, sensitivity \(d’\) and response threshold \(c\) can easily be calculated from the observed rates of old responses,
\[
\begin{align}
\hat{d’} & = \Phi^{-1}(\text{Hits}) – \Phi^{-1}(\text{False alarms}), \\
\hat c & = -\frac{\Phi^{-1}(\text{Hits}) + \Phi^{-1}(\text{False alarms})}{2},
\end{align}
\] where \(\Phi^{-1}\) is the inverse cumulative distribution function of the standard normal distribution, also known as probit transformation or \(z\) scores.
Comparison of predictions
The mathematical expression of the three models can be used to drive specific predictions about the relationship between hits and false alarms. Consider the HTM. We can substitute false alarms for \(b\) and predict hits from false alarms,
\[
\text{Hits} = p + (1-p) \times \text{False alarms}.
\] The resulting equation takes the same form as the linear regression function \(y = a + b \times x_i\) discussed above, with the intercept \(a = p\) and the slope \(b = 1 – p\). Hence, HTM predicts a linear relationship between hits and false alarms. Intercept and slope of the linear relationship are determined by the probability of retrieving a memory, Figure 4. Moreover, intercept and slope are inversely related: As the intercept increases, the slope decreases.
The predicted linear relationship between hits and false alarms can be tested experimentally. Under conditions where the probability of retrieving a memory \(p\) can be assumed to be constant, manipulations that affect the probability of guessing ‘old’ \(b\) should yield a linear relationship between hits and false alarms; a nonlinear relationship between would contradict HTM.

Figure 4: Predicted relationship between hits and false alarms according to high-threshold model (HTM), equal-variance (EVSDT), and unequal-variance signal detection theory (UVSDT). The predictions for UVSDT assume a constant sensitivity of \(d_a = 2.00\) to illustrate the models additional flexibility relative to EVSDT. When \(\sigma_{\mathrm{Old}} = 1.00\), UVSDT and EVSDT make identical predictions. The dotted lines indicate chance performance.
Predictions can similarly be derived for EVSDT, Figure 4. Inspection of the predicted relationships reveals that HTM and EVSDT make distinct predictions. EVSDT predicts a curved relationship between hits and false alarms where the curvature increases with the strength of the memory signal for old probes, that is the sensitivity \(d’\). Again, this constitutes an experimentally testable prediction. A comparison of the predictions of HTM and EVSDT further suggests that a paradigm that yields a medium probability of retrieving a memory or a discriminability of around \(d’ = 1.5\) would be most informative for the model comparison—the line and the curved function are distinguishable in the medium ranges of hits and false alarms.
Finally, the predictions of UVSDT illustrate the effect of assuming increased variability in the mnemonic strength distribution of old probes, Figure 4. The relationship between hits and false alarms becomes more linear in the medium and high range of false alarms. Moreover, the predictions illustrate the increased complexity of the model. When the variability in the mnemonic signal for old probes equals that of new probes UVSDT mimics EVSDT—both models make identical predictions. When the variability for old probes is large and the response threshold is low the model can predict false alarm rates that are higher than the hit rates. This observation would contradict both HTM and EVSDT.
How can the predictions be empirically tested?
As previously discussed, HTM and SDT can be used to decompose participants responses and isolate memory processes from guessing or response criteria. However, decomposition rests on the assumption that the measurement model provides a reasonably accurate description of the processes involved in recognition memory. If the assumption of the model are violated the results of the decomposition may be misleading—indices of memory performance may in part reflect processes unrelated to memory retrieval. This poses a problem: The cognitive processes involved in recognition memory cannot be observed. We can, however, compare the diverging model predictions to observed data. The model that provides the best description of the observed data—given its complexity—would be considered to provide the least implausible characterization of the latent processes. Such model comparisons do not prove that the favored model is the true model. Rather they indicate that the favored model is the least implausible. Given that it describes all relevant patterns in the data, it may provide a reasonably accurate description of the processes involved in recognition memory.
The predictions derived for HTM, EVSDT, and UVSDT suggest an experimental design to pit the models against one another. Consider the following hypothetical study inspired by Swets et al. (1961; cf. Kellen, Erdfelder, Malmberg, Dubé, & Criss, 2016). Four participants study a list of 150 words. They are instructed to memorize the list as they will be asked to remember them later. In the subsequent recognition test, another 150 new words are mixed with the study list. That is, the test list consist in equal parts of old and new memory probes. Participants receive compensation depending on their performance: They receive a bonus for every hit but a malus for every false alarm. The test list is randomly grouped into 10 sublists and the extend of the malus is varied across the sublists. Because the incentive manipulation is introduced in the test phase—all memory probes are studied as parts of the same list—we assume that it only affects processes unrelated to memory performance (i.e., guessing or response threshold). With constant memory performance HTM predicts a linear, EVSDT a symmetric curved, and UVSDT an asymmetric curved relationship between hits and false alarms.

Figure 5: Scatter plot of hits and false alarms for the hypothetical experiment. Lines indicate the best description of the data from high-threshold model, equal-variance, and unequal-variance signal detection theory. The dotted lines indicate chance performance. The data used here are simulated.
The results of the hypothetical study along with the best descriptions from each model are shown in Figure 5. Visual inspection of the plots suggests that the linear function predicted by HTM may be a decent characterization of Participant 1’s responses. However, one condition with few false alarms and hits deviates from the linear prediction and is captured much better by the SDT models. The responses by Participant 3 appear to be best described by UVSDT. There, again, is one condition with few false alarms and hits that deviates from the linear prediction. Moreover, in another condition there are more false alarms than hits—a result that only UVSDT can explain. But are the observed deviations extreme enough to support one model over the other?
Firm conclusions require statistical model comparisons. For this example I will use two information criteria, AIC\(_c\) and BIC, that quantify the models’ predictive accuracy and penalize them for their respective complexity (see Aho, Derryberry, & Peterson, 2014 for an overview), albeit crudely4. BIC penalizes model complexity more strongly than AIC\(_c\). In both cases lower values indicate better model fits. Both information criteria can be used to calculate model weights (\(w\)AIC\(_c\) and \(w\)BIC) that indicate the probability that a given model is the best model among the tested set (Wagenmakers & Farrell, 2004).
In the context of nonlinear cognitive models, such as the three models under consideration here, it has been shown that aggregating responses across participants can bias parameter estimates and lead to incorrect conclusions (e.g., Curran & Hintzman, 1995; Estes, 1956). Hence, it is not appropriate to analyse all responses jointly as if they orginated from a single participant. Alternatively, if enough data are available, the models can be compared individually for each participant (see Lewandowsky & Farrell, 2011) or jointly using advanced hierarchical modeling techniques (e.g., Rouder & Lu, 2005). For simplicity, I fit the models to each participants’ responses individually.
Figure 6 illustrates the results of the statistical model comparison. The AIC\(_c\) analysis indicates that UVSDT provides the best description for the responses of Participants 2, 3, and 4, whereas HTM provides the best description for Participant 1’s responses because these models have the lowest AIC\(_c\) values. The results of the BIC analysis are similar but the simpler models fare better due to the added penalty for the extra variance parameter in UVSDT. For example, in case of Participant 2 BIC indicates that EVSDT is the best model. The extend to which each model is to be preferred is best reflected in the model weights.

Figure 6: Heat maps of by-participant model comparisons based on Akaike Information Criterion differences (\(\Delta\)AIC\(_c\)), Akaike weights (\(w\)AIC\(_c\)), and Bayesian Information Criterion differences (\(\Delta\)BIC), and Schwarz weights (\(w\)BIC).
Beyond the comparison of the individual models, model weights can be combined to jointly compare the latent strength models to the discrete state model, e.g.,
\[
\frac{w\text{AIC}_c^{(\text{HTM})}}{0.5 \times (w\text{AIC}_c^{(\text{EVSDT})} + w\text{AIC}_c^{(\text{UVSDT})})}.
\]
The joint model comparison provides a direct test of the research question while taking into account the uncertainty about the implementation of the latent strength hypothesis. According to the AIC\(_c\) the discrete-state model is favored 3.64-to-1 for Participant 1—mildly informative. The latent strength models are favored 1,220.49, 5.99, and 9.24-to-1 for Participants 2, 3 and 4. According to the BIC the discrete model is favored 19.29-to-1 for Participants 1, whereas the latent strength models are favored 373.18, 1.02, and 1.58-to-1 for Participants 2, 3, and 4.
To conclude, the results are somewhat contingent on the employed information criterion but indicate that overall the latent strength models tested here may provide a better description of the observed data.
Where can I learn more?
I hope this blog post has illustrated how theoretical positions can be expressed in mathematical terms and how mathematical models of cognition can help to test and compare psychological theories. If you want to learn more, I highly recommend the book by Lewandowsky & Farrell (2011) for a general introduction and the book by Lee & Wagenmakers (2014) for a detailed introduction into Bayesian estimation techniques for cognitive models, which I haven’t covered here. Also, I would like to encourage anyone to post further suggestions for introductory materials in the comments.
References
Aho, K., Derryberry, D., & Peterson, T. (2014). Model selection for ecologists: The worldviews of aic and bic. Ecology, 95(3), 631–636. doi:10.1890/13-1452.1
Baddeley, A. (1986). Working Memory. Oxford: Oxford University Press.
Blackwell, H. R. (1963). Neural Theories of Simple Visual Discriminations. Journal of the Optical Society of America, 53(1), 129–160. doi:10.1364/JOSA.53.000129
Bröder, A., & Schütz, J. (2009). Recognition ROCs are curvilinear – Or are they? On premature arguments against the two-high-threshold model of recognition. Journal of Experimental Psychology – Learning, Memory, and Cognition, 35(3), 587–606. doi:10.1037/a0015279
Cavagnaro, D. R., Myung, J. I., Pitt, M. A., & Kujala, J. V. (2009). Adaptive Design Optimization: A Mutual Information-Based Approach to Model Discrimination in Cognitive Science. Neural Computation, 22(4), 887–905. doi:10.1162/neco.2009.02-09-959
Curran, T., & Hintzman, D. L. (1995). Violations of the independence assumption in process dissociation. Journal of Experimental Psychology: Learning, Memory, and Cognition, 21(3), 531–547. doi:10.1037/0278-7393.21.3.531
Eich, J. M. (1982). A composite holographic associative recall model. Psychological Review, 89(6), 627–661. doi:10.1037/0033-295X.89.6.627
Estes, W. K. (1956). The problem of inference from curves based on group data. Psychological Bulletin, 53(2), 134–140. doi:10.1037/h0045156
Hintzman, D. L. (1984). MINERVA 2: A simulation model of human memory. Behavior Research Methods, Instruments, & Computers, 16(2), 96–101. doi:10.3758/BF03202365
Kahana, M. J., & Sekuler, R. (2002). Recognizing spatial patterns: A noisy exemplar approach. Vision Research, 42(18), 2177–2192. doi:10.1016/S0042-6989(02)00118-9
Kellen, D., Erdfelder, E., Malmberg, K. J., Dubé, C., & Criss, A. H. (2016). The ignored alternative: An application of luce’s low-threshold model to recognition memory. Journal of Mathematical Psychology, 75, 86–95. doi:10.1016/j.jmp.2016.03.001
Kortt, M., & Leigh, A. (2010). Does size matter in australia? Economic Record, 86(272), 71–83. doi:10.1111/j.1475-4932.2009.00566.x
Lee, M. D., & Wagenmakers, E.-J. (2014). Bayesian Cognitive Modeling: A Practical Course. Cambridge, NY: Cambridge University Press.
Lewandowsky, S., & Farrell, S. (2011). Computational Modeling in Cognition: Principles and Practice. Thousand Oaks, CA, US: SAGE.
Luce, R. D. (1963). A Threshold Theory for Simple Detection Experiments. Psychological Review, 70(1), 61–79. doi:10.1037/h0039723
Macmillan, N. A., & Creelman, D. C. (2005). Detection theory: A user’s guide (2nd ed., Vol. xix). Mahwah, NJ, US: Lawrence Erlbaum Associates Publishers.
Mandler, G. (1980). Recognizing: The judgment of previous occurrence. Psychological Review, 87(3), 252–271. doi:10.1037/0033-295X.87.3.252
Murdock, B. B. (1993). TODAM2: A model for the storage and retrieval of item, associative, and serial-order information. Psychological Review, 100(2), 183–203. doi:10.1037/0033-295X.100.2.183
Myung, J. I., & Pitt, M. A. (1997). Applying Occam’s razor in modeling cognition: A Bayesian approach. Psychonomic Bulletin & Review, 4(1), 79–95. doi:10.3758/BF03210778
Myung, J. I., & Pitt, M. A. (2009). Optimal experimental design for model discrimination. Psychological Review, 116(3), 499–518. doi:10.1037/a0016104
Myung, J. I., Cavagnaro, D. R., & Pitt, M. A. (2013). A tutorial on adaptive design optimization. Journal of Mathematical Psychology, 57(3), 53–67. doi:10.1016/j.jmp.2013.05.005
Myung, J. I., Navarro, D. J., & Pitt, M. A. (2006). Model selection by normalized maximum likelihood. Journal of Mathematical Psychology, 50(2), 167–179. doi:10.1016/j.jmp.2005.06.008
Nosofsky, R. M., & Palmeri, T. J. (2014). An Exemplar-Based Random-Walk Model of Categorization and Recognition. In J. Busemeyer, J. Townsend, Z. Wang, & A. Eidels (Eds.), Mathematical and Computational Models of Cognition. Oxford University Press. Retrieved from http://catlab.psy.vanderbilt.edu/wp-content/uploads/NP-Oxford2014.pdf
Palminteri, S., Wyart, V., & Koechlin, E. (2017). The Importance of Falsification in Computational Cognitive Modeling. Trends in Cognitive Sciences, 21(6), 425–433. doi:10.1016/j.tics.2017.03.011
Pitt, M. A., Myung, J. I., & Zhang, S. (2002). Toward a method of selecting among computational models of cognition. Psychological Review, 109(3), 472–491. doi:10.1037/0033-295X.109.3.472
Roberts, S., & Pashler, H. (2000). How persuasive is a good fit? A comment on theory testing. Psychological Review, 107(2), 358. doi:10.1037/0033-295X.107.2.358
Rouder, J. N., & Lu, J. (2005). An introduction to bayesian hierarchical models with an application in the theory of signal detection. Psychonomic Bulletin & Review, 12(4), 573–604. doi:10.3758/BF03196750
Shiffrin, R. M., & Steyvers, M. (1997). A model for recognition memory: REM—retrieving effectively from memory. Psychonomic Bulletin & Review, 4(2), 145–166. doi:10.3758/BF03209391
Swets, J. A., Tanner, W. P. J., & Birdsall, T. G. (1961). Decision Processes In Perception. Psychological Review, 68(5), 301–340. doi:10.1037/h0040547
Wagenmakers, E.-J., & Farrell, S. (2004). AIC model selection using Akaike weights. Psychonomic Bulletin & Review, 11(1), 192–196. doi:10.3758/BF03206482
Yonelinas, A. P. (2002). The Nature of Recollection and Familiarity: A Review of 30 Years of Research. Journal of Memory and Language, 46(3), 441–517. doi:10.1006/jmla.2002.2864
- The models presented in the blog post make rather abstract assumptions about the involved cognitive processes. Some mathematical models commit to more specific assumptions and mechanisms. These models are referred to as process models although the distinction between measurement models and process models is continuous rather than dichotomous.↩
- Fitting this model to data requires several additional assumptions, such as independent and identically distributed prediction errors, that I will pass over in the interest of brevity as they are irrelevant to the models’ predictions. Also, note that linear regression models can be extended to predicted nonlinear relationships, for example, by adding exponantiated predictor terms such as \(c \times x_i^2\).↩
- Another long-standing debate revolves around whether our episodic long-term memory is a unitary storage or whether it consists of multiple qualitatively different memory systems (e.g., Mandler, 1980; Yonelinas, 2002). For simplicity we will ignore this debate and focus on theories that assume episodic long-term memory to be a unitary storage.↩
- Both information criteria quantify model complexity by counting the number of free parameters. In nonlinear cognitive models not all parameters of each model grant the same flexibility. Modern model comparison methods allow the researcher to quantify model complexity in a more principled manner (Cavagnaro et al., 2009; Myung & Pitt, 2009; Myung et al., 2013).↩
